Good Management Budgeting
Budgets are important for a company to get a good grip on forecasted expenses and revenues. They allow you to measure your actual financial performance against the planned one.
OpenERP manages its budgets using both General and Analytic Accounts. Go to Settings ‣ Modules ‣ Modules and install account_budget to be able to do this.
The first step in defining budgets is to determine the general accounts for which you want to keep budgets (typically expense or income accounts). That is what you will use Budgetary Positions for, from the menu Accounting ‣ Configuration ‣ Budgets ‣ Budgetary Positions. Here you can select the general accounts for which you want to keep budgets. The aim is to group general accounts logically, according to sales or purchases, for instance. OpenERP has no limitations as to the account types that can be used for budgeting.
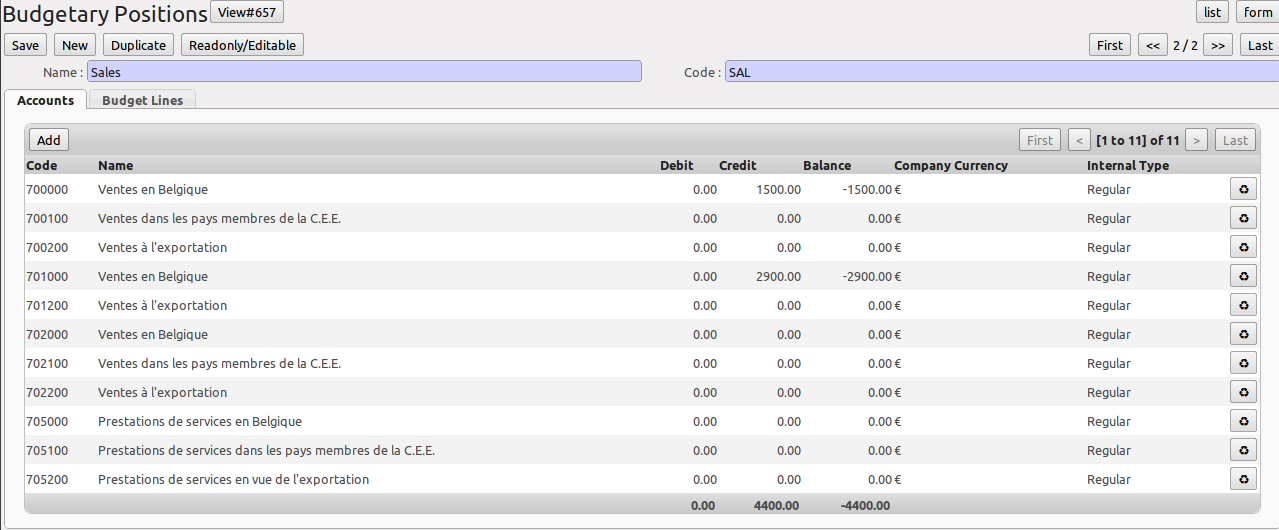
Budgetary Position for Sales
To define your budgets, go to the menu Accounting ‣ Budgets ‣ Budgets. Define a new budget by clicking the New button.
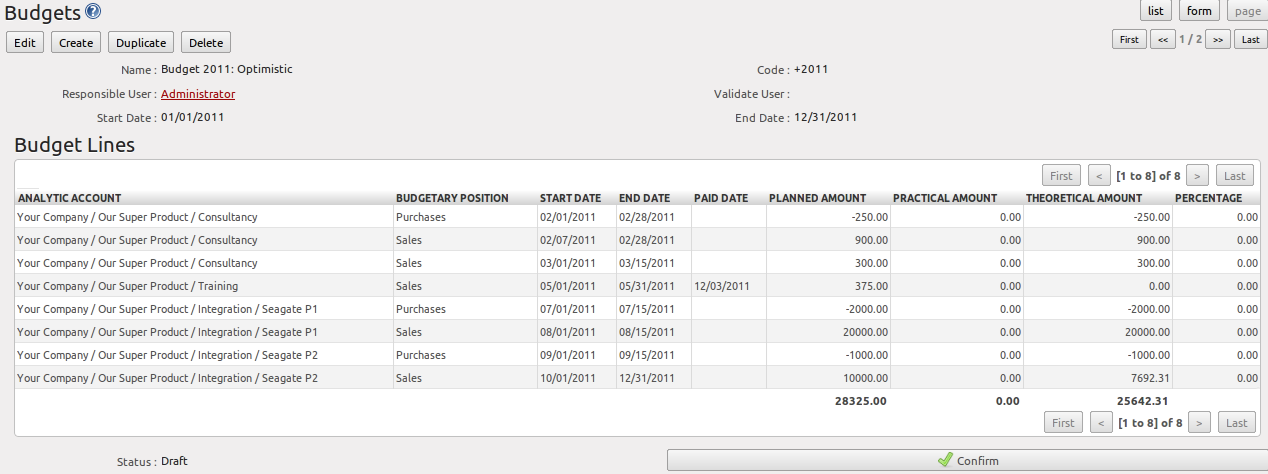
Optimistic Budget
Tip
Budget Revisions
Even though you can modify a budget at any time to make a revision, we recommend you to create a new budget, because otherwise you will have no history of changes.
Rather than edit an existing budget, make a new version so that you can keep your original estimates safe for comparison. This lets you analyse your changing perspectives of the company from revision to revision.
To define your budgets, start by entering a Name, a Code, a Start Date and an End Date for your new budget. Then you can define the budgeted amounts for each analytic account within a specified period, one by one (enter negative amounts for purchases, positive amounts for sales). For each, you define:
- an Analytic Account
- a Budgetary Position, for example Sales or Purchases,
- a Start Date and an End Date for the budget,
- a Planned Amount in the default currency of the chart of accounts.
Once this information is completed, save your budget.
A budget has various stages:
- Confirmed: the budget is to be reviewed, but it can still be changed before actual approval;
- Approved: the budget is approved by the budget holder; the name of the user approving the budget will be displayed in the Validate User field.
You can cancel a budget and reset it to draft for the two preceding steps.
- Done: the budget is fully approved and no changes will be allowed. You can no longer cancel the budget and reset it to draft.
The Theoretical Amount indicates the actual amount that might have been realised for the budget concerned according to the current date. When your budget is 1200 for 12 months, and today is the 30 October, the theoretical amount will be 1000, since this is the actual amount that could have been realised to date.
To print a budget and make calculations of expenditure through budget, use the menu Accounting ‣ Budgets ‣ Budgets. OpenERP then gives you a list of available budgets. Select one or more budgets and then click Print Budgets to create the report for each, in a date range of your choice.
The Print Budget report gives an overview of each analytic account included in your budget, according to the individual budgetary positions for that account. From the percentage and the comparison of planned (budgeted) and practical (actual) amounts, you have a good view on your situation.
From the same list of actions, you can also print the Print Summary report, which will give you a total per analytic account (without splitting by budgetary position).
Each of these reports can be printed from a specific date to a specific date. The End Date selected in the wizard determines how the theoretical amount will be calculated; if you select the last day of your financial year, the theoretical amount will be calculated as a function of that date (thus considering a complete financial year). Note that the theoretical amount will be zero when the Paid Date entered is equal to or greater than the End Date for the budget.
The percentage for a budget is calculated as follows: (practical amount / theoretical amount) x 100. This way you get a view on how much of the forecasted amount has been actually realised in your accounting.
The figure Printing a Budget gives an example of a budget produced by OpenERP.

Printing a Budget
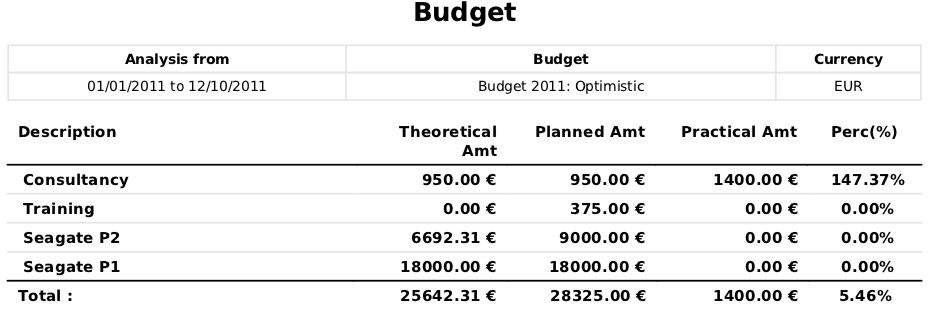
Summarised Budget
You could also use the menu Accounting ‣ Reporting ‣ Generic Reporting ‣ Budgets ‣ Budget Lines. This gives an analysis of each budget line.
From the menu Accounting ‣ Configuration ‣ Budgets ‣ Budgetary Positions, you can print the budgets for an individual budgetary position. Open a budgetary position, and click the Budget Lines tab for a graphical representation of your budgetary position.
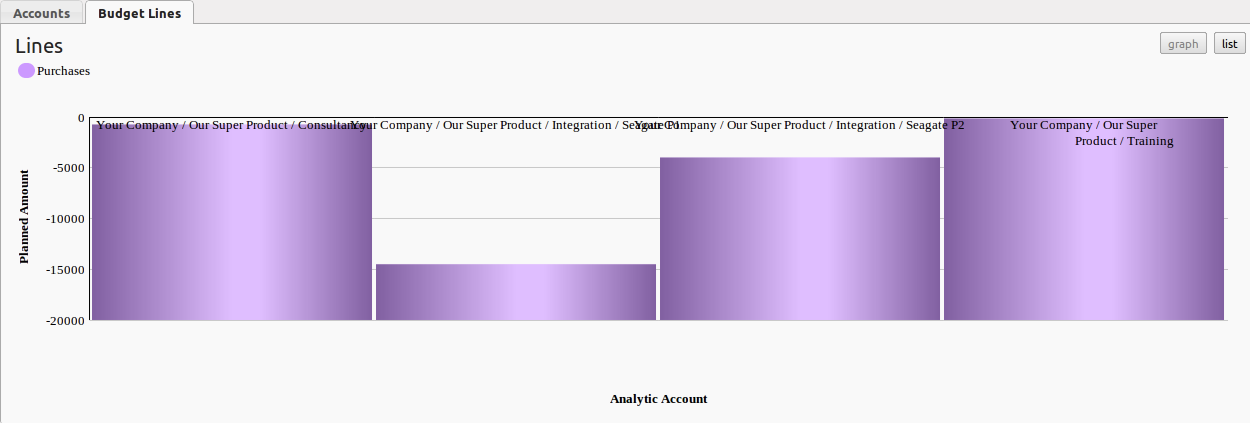
Graphical Representation of Budgetary Position
Note
Print Reports
You can also print budgets from the menu Accounting ‣ Configuration ‣ Analytic Accounting ‣ Analytic Accounts.
The Accounting Dashboard
You can open the Accounting Dashboard in more than one way: either by clicking the Accounting button at the top of the web screen, or from the menu Accounting ‣ Reporting ‣ Dashboard ‣ Accounting Dashboard.
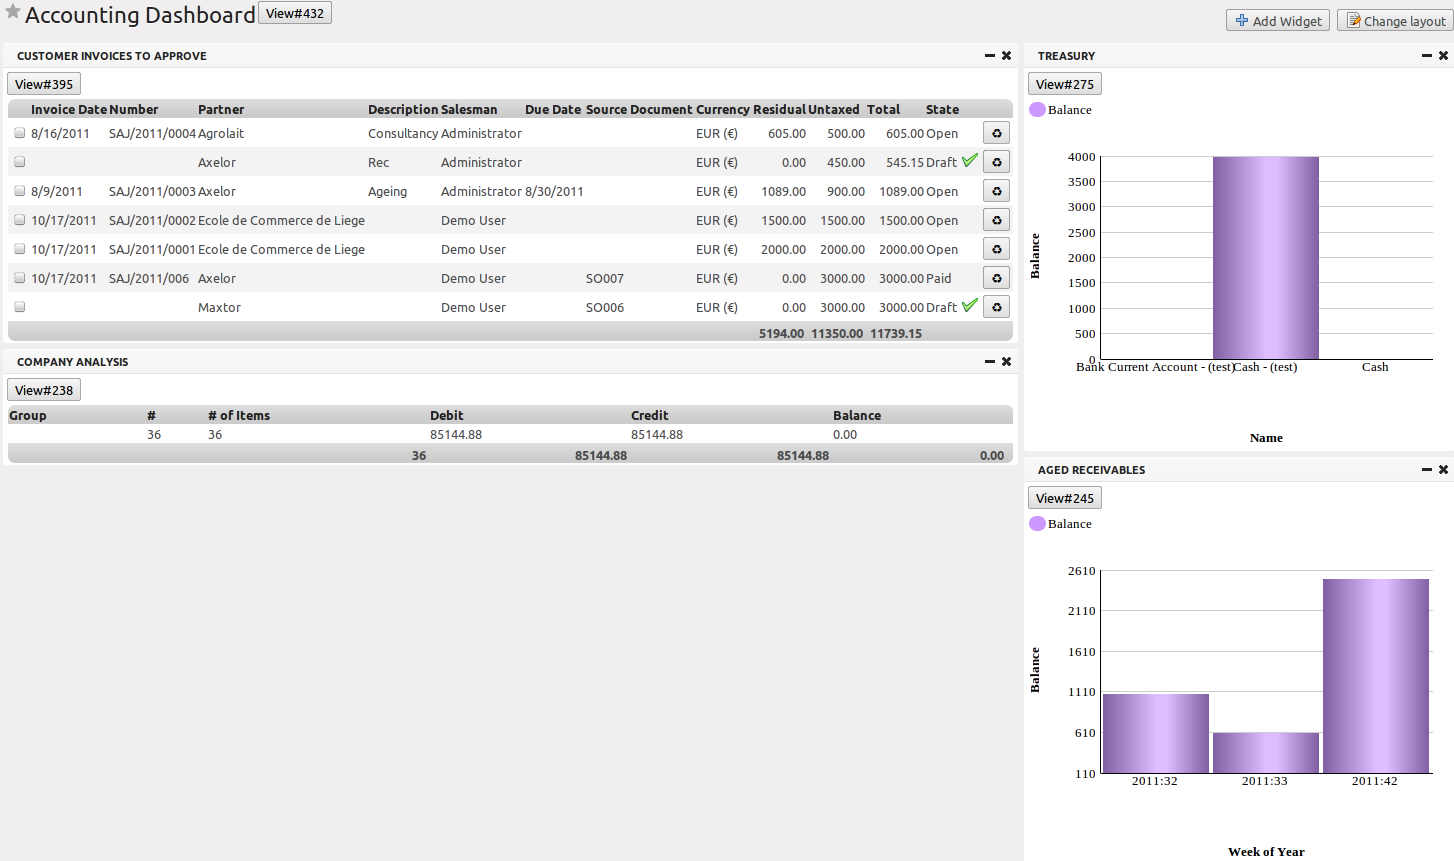
Accounting Dashboard
OpenERP gives you an accounting dashboard that will be presented to your accounting staff as they sign in to the Accounting system (you can also set the dashboard as their Home Page by setting the Home Action to Accounting Dashboard in the User form). This dashboard provides an analysis of the company’s financial health at a glance.
The description of the different parts of the dashboard, from top to bottom, then from left to right, is as follows:
- Customer Invoices to Approve : gives the list of invoices waiting to be approved by an accountant.
- Company Analysis : lists the debit, credit and balance of all account types.
- Treasury : shows the balance per Bank account in graphical view.
- Aged Receivables : gives a weekly graph of the receivables that have not yet been reconciled.
For most of the panels of the Accounting Dashboard, you can click a line or a graph to investigate the detail of your financial indicators.
The Accounting Dashboard is dynamically integrated, which means that you can navigate easily through the data if you want more detail about certain factors, and edit the entries if necessary.
The Change Layout button at the top right allows you to change the way the dashboard is displayed; you can choose among several options, such as one column, two columns, etc. You can also add other features to the dashboard and customise it to your needs with the Add Widget button. You can easily Undo changes or Reset the original dashboard.